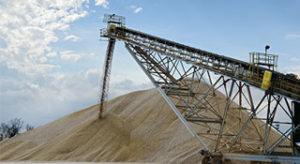
An estimated 680 million metric tons (Mt) of construction aggregate were produced and shipped for consumption in the United States in the second quarter of 2019, the U.S. Geological Survey (USGS) reports.
The 680 Mt is a 3 percent increase compared with the second quarter of 2018.
The mark comes on the heels of a first quarter in which aggregate production was up 9 percent compared with the first quarter of 2018.
For the second quarter of 2019, the five states producing the most aggregate for consumption were Texas, California, Pennsylvania, Florida and Ohio. Their combined total production for consumption was 198 Mt and represented 29 percent of the U.S. total.
Overall, aggregate production for consumption in the first six months of the year increased 5 percent compared with the first six months of 2018.
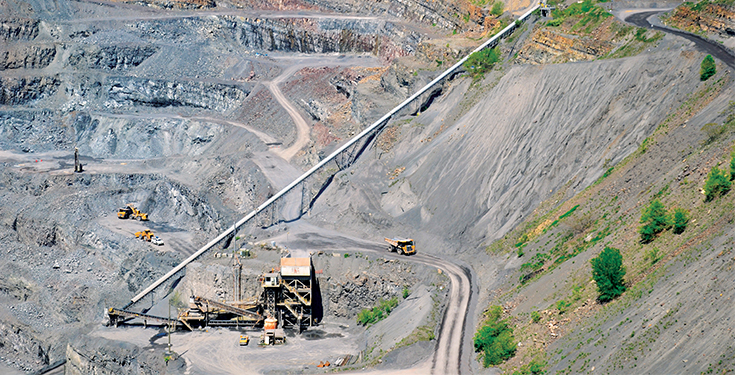
Crushed stone
Of the 680 Mt of total construction aggregate produced for consumption in the second quarter, 406 Mt was crushed stone. The mark represented an increase of 4 percent compared with the second quarter of 2018.
The five leading crushed stone-producing states were Texas, Pennsylvania, Florida, Missouri and North Carolina. Their combined total production for consumption in the second quarter was 135 Mt and represented 33 percent of the U.S. total.
Crushed stone production for consumption in the first six months of 2019 was up 8 percent compared with the first half of 2018.
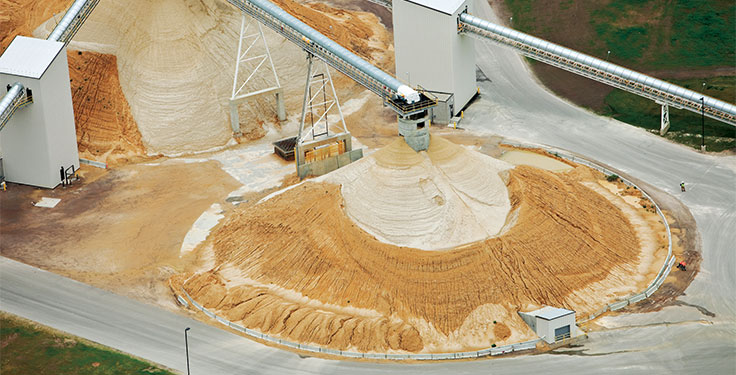
Sand and gravel
In sand and gravel, the estimated U.S. output produced and shipped for consumption in the second quarter was 273 Mt. That’s a slight increase compared with the second quarter of 2018.
The five leading sand and gravel-producing states were Texas, California, Arizona, Minnesota and Michigan. Their combined total production for consumption was 101 Mt and represented 37 percent of the U.S. total.
Sand and gravel production for consumption in the first six months of 2019 also increased slightly compared with the first half of 2018.
About the data
The estimates above are based on information reported to USGS on its quarterly sample survey of aggregate producers.