FULL HANDBOOK
Chapter 1: Industry Overview
Chapter 2: Geology & Site Selection
Chapter 3: Drilling & Blasting
Chapter 4: Excavating & Loading
Chapter 5: Hauling
Chapter 6: Crushing & Hydraulic Breaking
Chapter 7: Screening
Chapter 8: Washing & Classifying
Chapter 9: Conveying & Material Handling
Chapter 10: Loadout & Weighing
Chapter 11: Safety & Health
IN THIS CHAPTER
ERI
Aggregate resource developers looking to mine sand and gravel deposits may be working with less-than-optimal information if they rely too heavily on traditional sampling programs involving test pits and percussion drilling. This is particularly the case when it comes to complex granular deposits.
Definition
Electrical Resistivity Imaging (ERI): A geophysical technique that measures subsurface resistance to electrical current, helping map overburden thickness, grain size and aggregate distribution.
Percussive drilling does not always yield representative samples. As the return rate of the sample to surface varies, samples are highly disturbed and may have been contaminated with drilling fluid. Test pits can provide a good picture of the undisturbed resource, but they can rarely reach more than 20 to 25 ft. below the surface.
Perhaps the biggest difficulty with these sampling techniques is that they produce point measurements, meaning they are only reliable if the deposit has good continuity. More drilling and digging can increase accuracy, but this can become expensive. It can also be intrusive because of noise, vehicle traffic, impacts on sensitive features and disturbance to existing land uses such as agriculture.
If extraction goes ahead based on plans generated by sampling alone, it may be difficult to extract the resource wisely and provide a reliable, predictable product to customers. Often, operators end up “chasing” the resource instead of planning around it.
&uuid=(email))
How electrical resistivity works
Because of the limitations of test pits and drill samples, it may be wise to increase the accuracy of the aggregate depositional model and extraction plan through a technique that can fill in the gaps.
A geophysical tool known as the electrical resistivity imaging (ERI) method has been used over the past few decades for aggregate resource evaluations. It is a mature and widely accepted technology.
It’s important to understand ERI’s advantages and limitations for aggregate resource evaluation and planning, though. ERI measures the level of resistance to electrical current of the subsurface to infer rock/soil types, stratigraphy and soil conditions. This is possible because:
- Water infiltrating the ground allows electrical current to flow through it more easily, as it is highly conductive. The minerals themselves are highly resistant to electrical flow.
- Resistivity can also help indicate the degree of interconnectedness of the pores – poorly interconnected pore space means the current must pass through grains, so measured resistivity may be higher.
- Resistivity is generally lower in materials where the grains themselves are polarized (like miniature compass needles), as is the case with clays.
These combined factors mean higher resistivity generally indicates the grains in the soil are larger, and lower resistivity indicates smaller-size grains. Experience with various soil types and understanding the range of resistivity typically found with each material helps trained specialists develop a picture of the resource’s depositional environment.
Electrical resistivity usually uses a four-electrode setup. Metal rods are inserted into the soil from the surface. In one popular configuration called the Wenner method, the distance between each electrode is the same. Current is passed between two of the electrodes, and the change in the potential field is measured between the other two electrodes.
If a short distance is present between electrodes, the image of the subsurface generated will be shallower than it is if electrodes are further apart. So, testing may start with short-distance measurements. Then, readings are taken from the same location with the electrodes further apart to build a more complete picture of the subsurface. Most modern ERI systems use arrays of 56 or more electrodes.
Two- or three-dimensional modeling software, depending on the type of testing completed, is used to convert the apparent resistivity profile, called a pseudosection, to true model resistivity profile. The result is information that, when combined, can be used to interpret soil conditions and to plan extraction.
Limitations
Still, producers must understand both the advantages and limitations of the ERI method, as well as how to use it for effective planning. Four of the main factors influencing ERI results are:
1. Depth of deposit. Like trying to look through fog or mist, distant objects are hard to interpret. The resolution and accuracy of ERI data declines as the depth increases. This is because while electrodes that are further apart can provide measurements deeper into the deposit, the resolution is averaged over a longer distance. And this means changes in resistivity are less likely to be resolved at lower depths.
2. Transition zone of saturation. In the transition zone above the water table, electrical resistivity changes are mainly in response to changes in moisture content rather than changes in grain size distribution. ERI works well above and below the transition zone, but it is less accurate in the zone where the transition occurs. The thickness of the transition zone depends on pore size. The larger the pore size, the thinner the transition zone.
3. Clean, well-drained sands. Fine-grained sands that are “clean” in that they do not have large amounts of clay or silt can sometimes show high-resistivity values that would otherwise be found in coarser grained materials, possibly leading to misinterpretation.
4. Cultural features. Metal fences, buried scrap metal and underground pipelines close to the ERI test line can influence results. It’s important to map these “cultural features” and check their influence on ERI results.
&uuid=(email))
Applying electrical resistivity
Being able to accurately map and plan for extraction is important in complex aggregate deposits. A seven-stage plan is recommended. This has proven to be effective in greenfield site development, as well as in operational expansions:
- Test lines to ensure the method works at the site
- Electrical resistivity imaging/profiling program
- Limited drilling program
- Grain size and moisture content analysis
- Modeling the resource
- Defining areas of favorable extraction ratios and tonnage estimates.
- Incorporation of results into a mining plan.
The integration of this data into a mining plan is the goal of the study – should the resource exist. When this occurs, the information should be used in conjunction with all historical data from previous site investigations.
This can help determine blending requirements for areas with marginal resources, as well as for areas likely to have main extraction potential. Also, this helps avoid future high grading of the resource on-site.
The ERI method has been effectively used in sensitive due diligence-type settings to provide potential purchasers with some level of confidence – prior to entering a deal – that the resource is there. This is particularly useful in cases when showing up with a drill rig is not feasible at the initial negotiation stages.
Wise planning, based on sound use of site data – including information from the ERI process – can mean more accurate prediction of available resources to reassure corporate management, as well as external stakeholders, that the resource is there and will be used wisely.
It also results in better, more profitable mining plans – and fewer surprises. Perhaps most importantly, tools such as ERI promote good resource management so that issues such as high grading for short-term financial gain can be eliminated in favor of longer-term extraction planning, providing greater return on investment and good resource stewardship.
FULL HANDBOOK
Chapter 1: Industry Overview
Chapter 2: Geology & Site Selection
Chapter 3: Drilling & Blasting
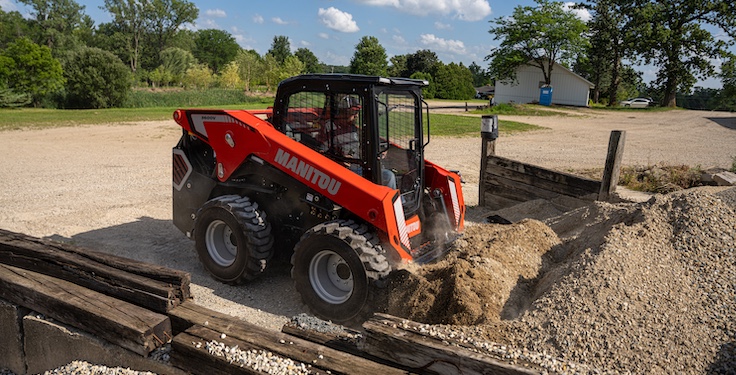
Chapter 4: Excavating & Loading
Chapter 5: Hauling
Chapter 6: Crushing & Hydraulic Breaking
Chapter 7: Screening
Chapter 8: Washing & Classifying
Chapter 9: Conveying & Material Handling
Chapter 10: Loadout & Weighing
Chapter 11: Safety & Health
IN THIS CHAPTER
Use the page numbers to continue reading, or select a section / chapter above.