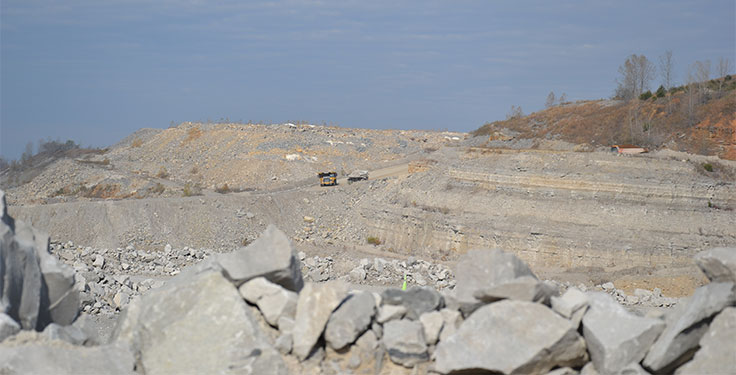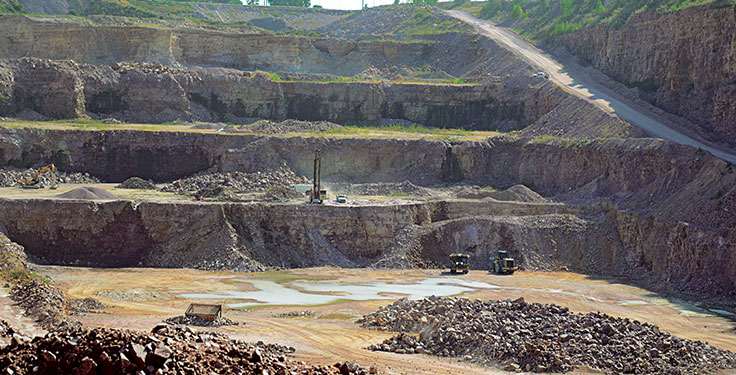

An estimated 744 million metric tons of construction aggregate were produced and shipped for consumption in the United States in the third quarter of 2019, the U.S. Geological Survey (USGS) reports.
The 744 million metric tons represent an increase of 8 percent compared with the third quarter of 2018.
Through the first nine months of the year, 1.87 billion metric tons of construction aggregate were produced for consumption. That’s an increase of 6 percent compared with the first nine months of 2018.
Aggregate production increased in eight of USGS’s nine geographic divisions compared with the third quarter of 2018.
Additionally, through the first nine months of the year, the top five aggregate-producing states were Texas, California, Ohio, Michigan and Pennsylvania. Their combined total was 541 million metric tons, an increase of 3 percent compared with the same 2018 period.
Crushed stone
In crushed stone, an estimated 446 million metric tons were produced and shipped in the third quarter this year. That’s a 9 percent increase compared with the prior year’s third quarter.
Through nine months, U.S. crushed stone production was up 8 percent overall to 1.14 billion metric tons. The five leading crushed stone-producing states through nine months were Texas, Pennsylvania, Missouri, Ohio and Florida.
Sand and gravel
The estimated U.S. output of construction sand and gravel produced and shipped for consumption in the third quarter of 2019, meanwhile, was 298 million metric tons. That’s an increase of 5 percent compared with the third quarter of 2018.
More than 725 million metric tons were produced through the first nine months of 2019. That’s a 3 percent increase compared with the same nine-month period of 2018.
The five leading sand and gravel-producing states through nine months were California, Texas, Minnesota, Michigan and Washington. Their combined total production was 261 million metric tons, an increase of 3 percent compared with the same period of 2018. The five states also represented 36 percent of the U.S. total.
The estimated figures USGS reports on crushed stone, sand and gravel are derived from the agency’s quarterly sample survey of aggregate producers.
Portland cement
In addition, portland cement consumption increased 7 percent in the third quarter of 2019 compared with the prior year’s third quarter. Consumption in the first nine months increased 4 percent compared with the same 2018 timespan.
USGS obtained its portland cement information through a monthly survey of cement producers.