![]() An estimated 646 million metric tons (Mt) of total construction aggregates were produced and shipped for consumption in the United States in the second quarter of 2016.
An estimated 646 million metric tons (Mt) of total construction aggregates were produced and shipped for consumption in the United States in the second quarter of 2016.
According to the U.S. Geological Survey (USGS), this is a 6 percent increased compared with the second quarter of 2015.
USGS adds that the estimated production for consumption in the first six months of 2016 was 1.09 billion metric tons, a 10 percent increase compared with that of the same period in 2015.
The estimated production for consumption of construction aggregates in the second quarter of 2016 decreased in two of the nine geographic divisions USGS measures, compared with that sold or used in the second quarter of 2015. The largest increases were noted in the Mountain, South Atlantic, and the East North Central divisions, USGS reports. Production for consumption increased in 25 of the 43 states that were estimated, with the five leading states including Texas, California, Michigan, Pennsylvania and Ohio. Their combined production for consumption was 179 Mt, a 5 percent increase. The 179 Mt represented 28 percent of the U.S. total.
Also, an estimated 377 Mt of crushed stone were produced and shipped for consumption in the United States in the second quarter of 2016, an increase of 6 percent compared with the second quarter of 2015. In addition, the estimated production for consumption in the first six months of 2016 was 648 Mt, an 11 percent increased compared with the same time period in 2015.
The estimated production for consumption of crushed stone in the second quarter of 2016 increased in six of the nine geographic divisions USGS measures compared with that sold or used in the second quarter of 2015, with the largest increases recorded in the Mountain and East North Central divisions. The five leading states were Texas, Pennsylvania, Florida, Ohio and North Carolina. Their combined total production for consumption was 116 Mt, which represented 31 percent of the U.S. total.
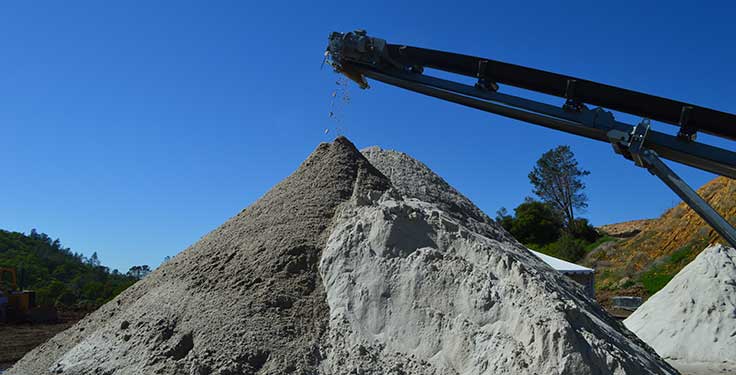
Finally, the estimated U.S. output of construction sand and gravel produced and shipped for consumption in the second quarter of 2016 was 269 Mt, a 6 percent increase compared with the second quarter of 2015. The estimated production for consumption in the first six months of 2016 was 443 Mt, an 8 percent increase compared with the same time period in 2015.
The estimated production for consumption of construction sand and gravel in the second quarter of 2016 increased in five of the nine geographic divisions compared with that sold or used in the second quarter of 2015. The largest increases were recorded in the Mountain and the South Atlantic divisions, with the five leading states being California, Texas, Utah, Michigan and Minnesota. Their combined total production for consumption was 97.9 Mt, which represented 36 percent of the U.S. total.
According to USGS, its sample survey generates production-for-consumption estimates by quarters, based on information reported voluntarily by a limited number of producing companies.